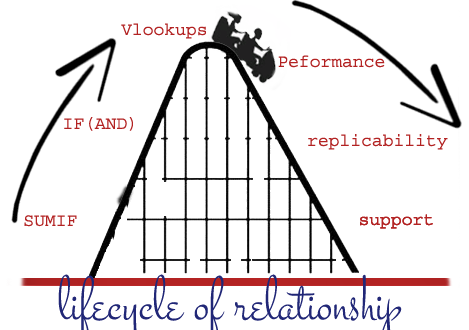
The case against Excel
Tweet
Though at first it might seem odd that, as an economist, I have decided to devote my first blog post
to Excel, I must admit that I have been surprised to see the number of professionals that use Excel for
serious data analysis. Thus, I consider it my “duty” to advise you against its perils and save you
countless hours and possible embarrassments. But don’t get me wrong! As a recovering Excel-holic,
I am a witness to Excel’s seductiveness. Its simplicity and instant gratification make the software
a bridge between the nerds and the pragmatic. Nonetheless, if you are using Excel as your main data
analysis tool, you must be warned that it is that very parsimoniousness which has the potential to
make your work worthless. Don’t believe me?
(See here,
here,
and
here.
I build my case on the following salient issues:
Hexadecimal and Zeros
I realized that the honeymoon phase was over with Excel when I had a dataset where one clumn consisted of 17 digit numbers. Four cups of coffee later I learned that Excel “follows the IEEE 754” on how to store and calculate floating-point numbers. Under this system unique IDs are no longer unique and any sort of math is unreliable. (Disclaimer: I have not worked with the latest version of excel)
Parallel to this issue is how excel handles zeros on the left side of a number. If your unique ID number starts with a 0 (mine is 09), then excel will display the number without the zero which will change the unique ID of the person. My main problem with this, however, is that Excel saves in the same manner it displays numbers. For example if your original CSV file contains a “09” and you open it in Excel and save it in CSV form, the file will be permanently change from “09” to “9”.
Handling Dates
Excel handles dates using a conversion that designates January 1st, 1900 as a reference point. Although there are some interesting issues such as assuming 1900 was a leap year (it was not) and problems when using dates from 1900, its principal trouble is Excel’s own interpretations. If your data is not fully “cleaned,” a column might have different row definitions.
As an example, suppose that you have a column containing the dates of independence of African countries. In this case for Lesotho you would most likely get 24384 which translates to October 4th, 1966. If, for any case (which will happen), your data contains any unaccounted quotes, commas, or symbols, then a row in the independence data column might get stored as text such as ‘30 September 1966. As your number observations grows, this issue becomes very difficult to deal with.

Performance
Another negative point of Excel is its meager performance. As your observations grow from the thousands to the hundreds of thousands (Excel’s max is 1,048,576), things start becoming really slow to a point of no-return. Try the following as an experiment- Fill 300,000 rows and 3 columns with random numbers or words and then try to do a search and replace. Then try the same exercise using a program like GVIM (as a + Gvim is free ).
Non-replicability, weird patterns and hidden formulas
Unless you are using VBA macros on your spreadsheet or doing a simple analysis, mapping all the formulas to their corresponding results is incredibly difficult. Without any “central” structure interpreting such things or catching any mistakes becomes very difficult. I once worked at a major bank who did all their risk assessments in this way. I made a lot of money as a consultant trying to figure out what the spreadsheet was doing as it had a life of its own.
Did I mention that OFFICE is expensive?
Last words
I want to emphasize that this post is directed at rising data scientists, researchers, and professionals
who rely on data analysis in their careers. For anyone else looking for a fast and painless analysis program,
I would argue that the fixed costs to learn other tools are too high and that it is probably better to master Excel instead of learning something new.
I would not help the cause by just providing criticism. After several months of frustration, I was eventually able to find software that meets my needs.
In case you are interested, here the methodology I use:
I keep the files in a text file. If I need to view them, I generally use Notepad++ .
If I need to do a search and replace (say over 100k rows and 15 columns) I use VIM (which isn’t visually pleasant but performs a lot faster). If I need to do serious data cleaning (files over 200mb)
I prefer to use F.A.R.T which performs a lot faster. To see other alternative see (link stack overflow) The benefit of these programs are that 1)there is a record and replicate easily, 2) they do not make any interpretations on the data and they are open source.
To do the data analysis and calculations, I use Ipython Notebook with the Numpy package. This is an incredible way to write and present your information. It gives you more flexibility and amazing replicability. On a close second place comes R which has great packages and support. All the software mentioned so far is open source. This, however, comes at a price. If you are not familiar with computer programming (you should, click here to start) then it can seem like a daunting task as the learning curve might be steep for your case.
My advice is that, if you plan to do serious data work, you should consider investing time in learning how to use these tools and graduate from the “excel wizard” to the “programming bachelor.” If you must or want to continue using Excel, then beware and take these things into account.