How to create maps with Stata
Tweet
Stata allows you to create a wide gamut of maps. I write this guide with two main goals in mind: to supplement the resources found online and to highlight functionalities that I find helpful. Stata is not the best software to create maps. Nonetheless knowing how to do so is a convenient way to avoid having to use multiple programss. We are going to use the package SPMAP created by Mauro Pisati and shp2dta by by Kevin Crow.
The material here is meant to be self-contained. If you want more resources click
here,
here,
and here
To create a map in Stata we have to do the following: 1) obtain the necessary GIS information, i.e. shapefiles and downalod packages, 2) create a Stata database from a shapefile , 3) identify the data we want to draw, and 4) add complexity by incorporating different features of Spmap. Today we are going to be drawing a map of the provinces of Italy. Specifically, we are going to draw the public efficiency of each province.
The entire code is available on GITHUB .
- Download the data and programs We will need two main files: GIS file and the data we want to draw. The first file contains all the neccesary spatial information. We obtain the file from the Istat page. Note that we can download maps of regions, provinces, and cities. For this exercise we will use the regional and province level shapefiles. We are using the 2011 version of the administrative boundaries. Now that we have the GIS data, we need the data to graph. We use general administrative data of provincial expenses from Open Civitas called 2010 Province - Indicatori generali. This data is also available on GITHUB so you can download everythiing at once.
- Create database from Shapefile Now that we have the data and programs installed, we need to "translate" the GIS into a form Stata will understand. This is done by using sh2dta command. Type this in your command line:
- Now we have the dataset created. Open it and explore it. You will see that the shapefile contains some key variables. Now we are going to import the Open Civitas file (to see how the file was create see the source code) containing the index of performance of each province. We see that each province has its name. Using this information, we can merge both datasets.
- Mapping Creating simple maps is very easy. The basic command is
Next you will need to install Scmap and shp2dta. Go to Stata and type the following in the command line:
									ssc install scmap


									ssc install shp2dta
									cd "C:\Users\..."	/*Set your directory*/


									shp2dta using prov2011_g.shp, database(itdb_prov)
   ---  coordinates(itcoord_prov)  gencentroids(stub)  genid(center)
In summary, this command reads the shapefile and creates two files. The first file "itdb_prov" from the option database
is a dataset of provinces/regions. The other itdb_coord_prov from the option coordinates provides the actual coordinates of each province. The option gencentroids() and genid()
provide the name for the centroids (in our case STUB) and the ID for each province/region in our case (center).
After doing this you should see two files in the directory
									itcoord_reg.dta


									itdb_reg.dta
Do the same procedure but now create a database for the regions.
									use  "indicators", clear


									rename provincia_istat_cod COD_PRO


									merge 1:1 COD_PRO using  "prov_inf"


									keep if _merge==3


									drop _merge


									merge 1:1 COD_PRO using  "itdb_prov"
spmap indicator using "itcoord_prov" , id(center)
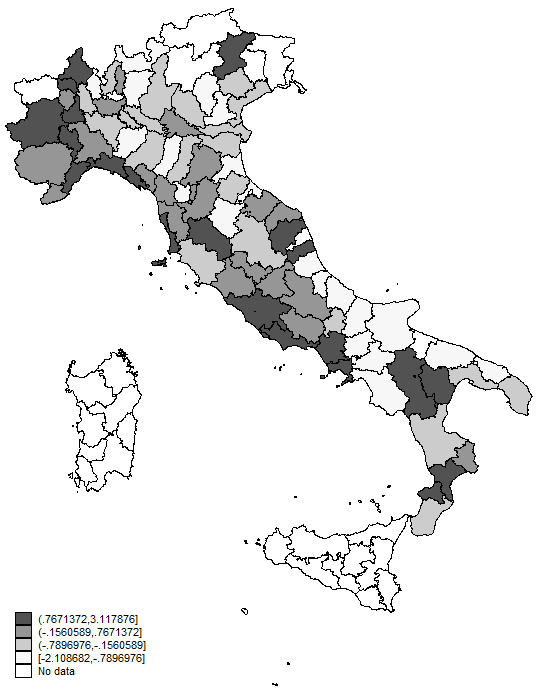
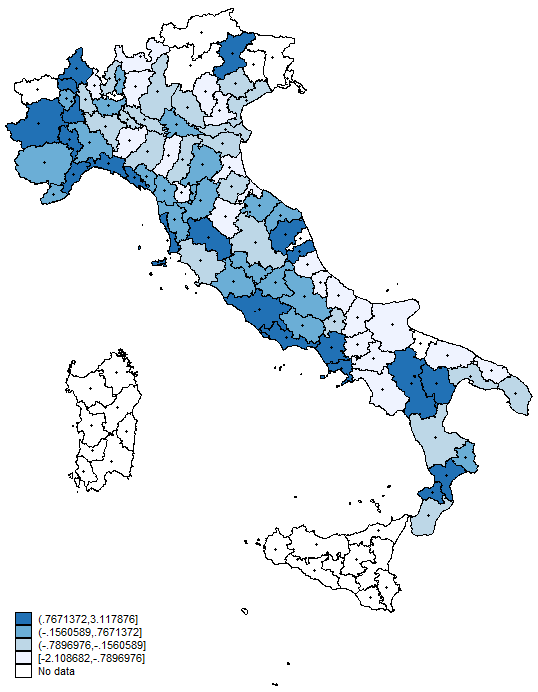
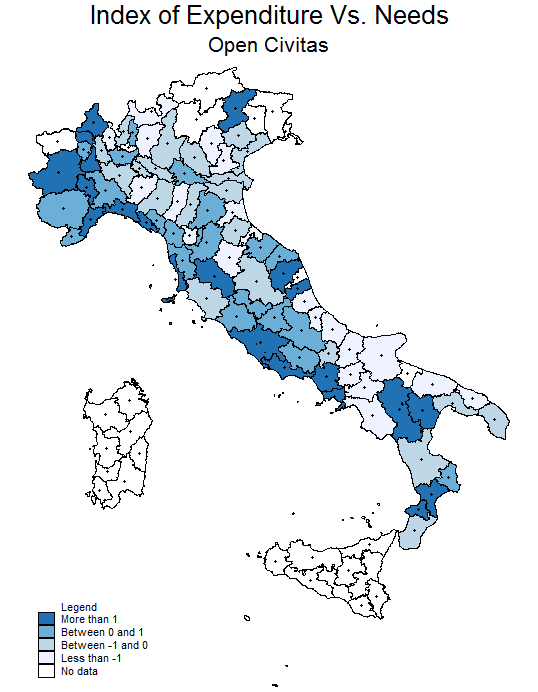
The map looks dull in grey. If we want to change the colors used, we use the option fcolor. We also choose to graph quantiles and have no outline. We can also add titles and only graph certain provinces (see do file)
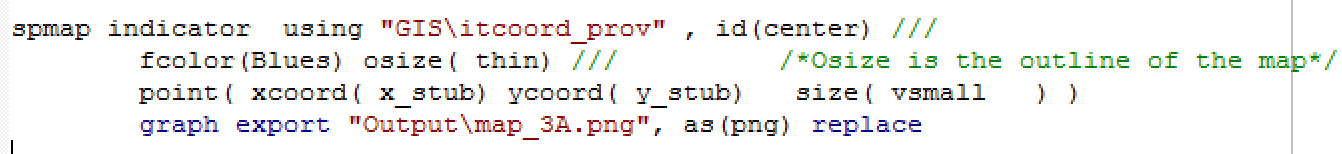
spmap indicator  using "itcoord_prov" , id(center)

											fcolor(Blues) osize(none) 	 clmethod(quantile)

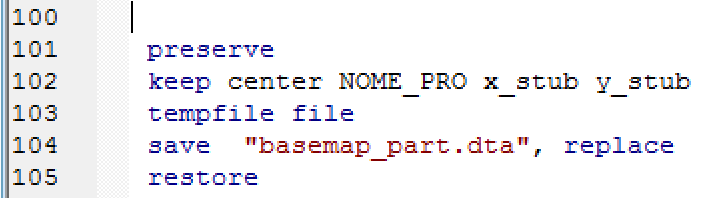
Using our master dataset we graph as before and then superimpose our newly created dataset on top of it. Here we use the point command which requires for us to specify the x and y coordinates which are found on the file we previosuly created.
Now we add some more bells and whistles
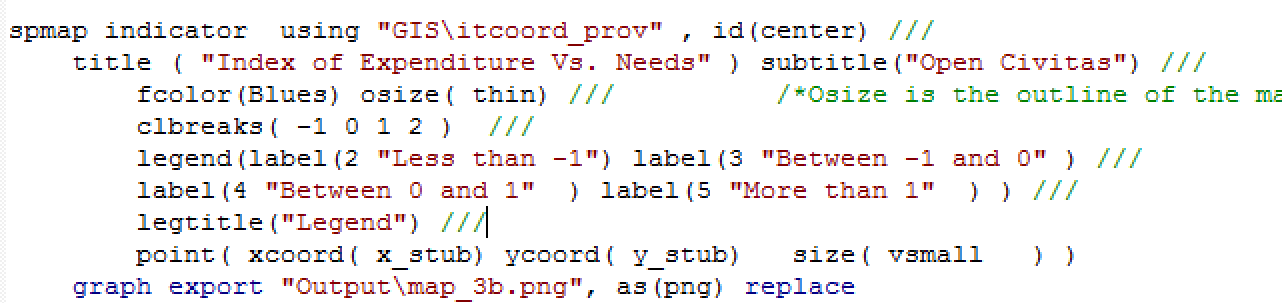
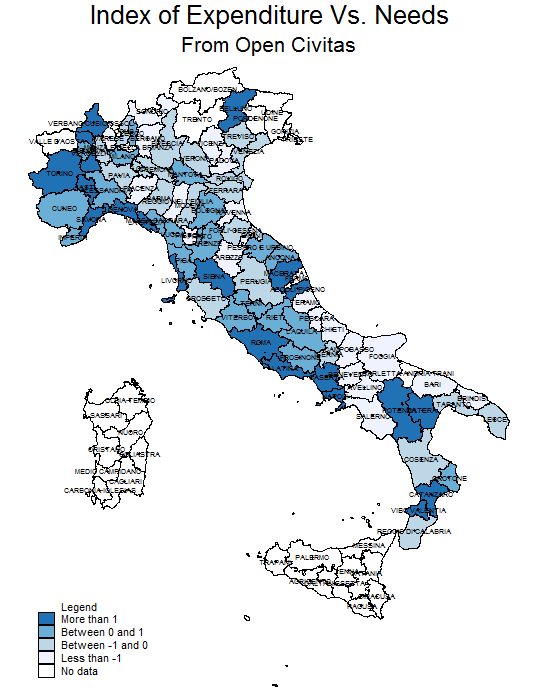
To add labels we use the label option and refer to the basemap_part file. We specify the x and y coordinates and the variable we want to add. Additional options include the size, lenght, and position of the labels.
									label(data("data\basemap_part.dta") xcoord( x_stub) ycoord(y_stub)

									label(NOME_PRO) size(*0.5 ..) position(0 6) length(26))
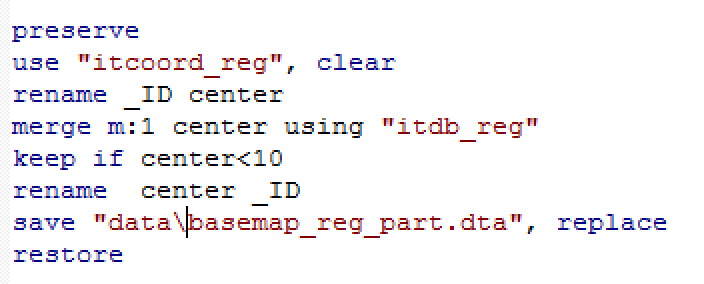
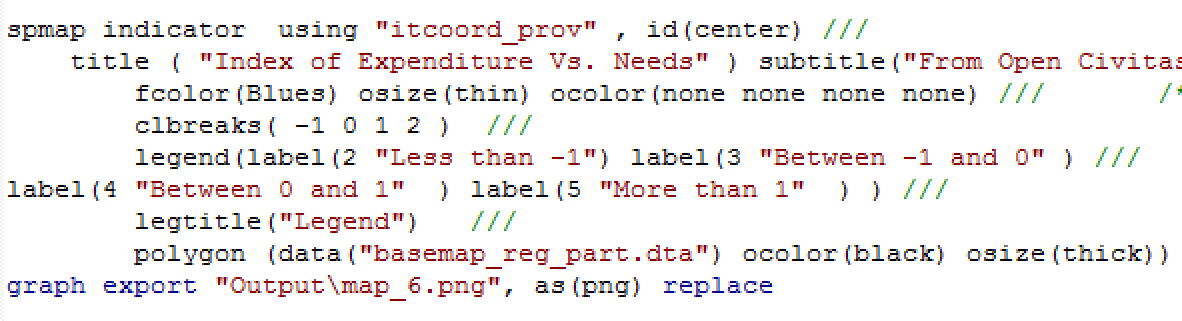
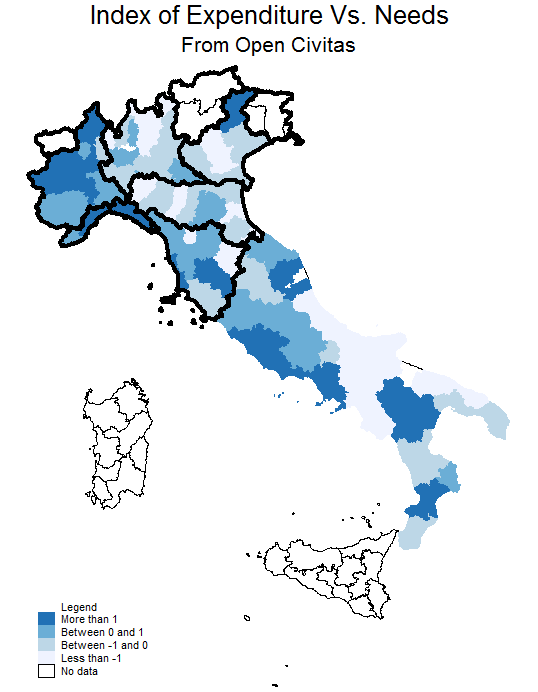
Now suppose that we want to add regional boundaries to our map. We first have to create a separate dataset containing the new boundaries we want to create. We use the region file cotaning the coordinates and merge it with the region file database. We save that as a separate datafile and then we use the polygon option.
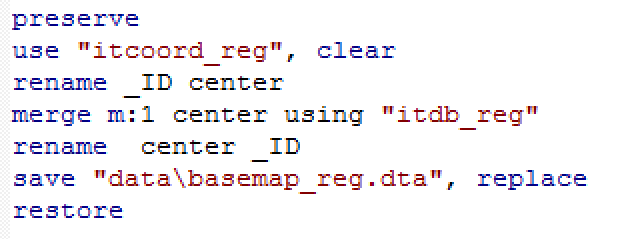

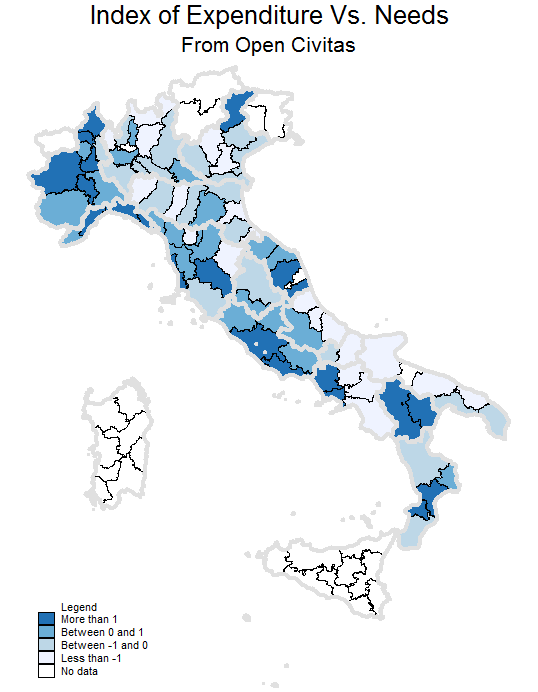
If we only wanted graph some regional boundaries, we use the file on regions and delete the ones we don't want to graph.
 These tools should provide you with enough knowledge to be able to make informative and interesting graphs. If you have a question, dont hesitate to send me an e-mail.