October, 2018
The OECD recently published updated statistics for wealth distribution across OECD countries. Below are some facts that show how wealth is distributed, how much share of total wealth do the richest households own, how many households are in debt, and how many individuals are asset poor. The code and additional details are here.
Facts about wealth distribution accross OECD countries
- The average household wealth in 2010 PPP terms is $258,600
- The richest OECD countries across are the US, UK and Luxemburg
- The poorest OECD countries are Latvia, Chile, and Hungary
- Overall, most household wealth is non-financial and is derived from home ownership
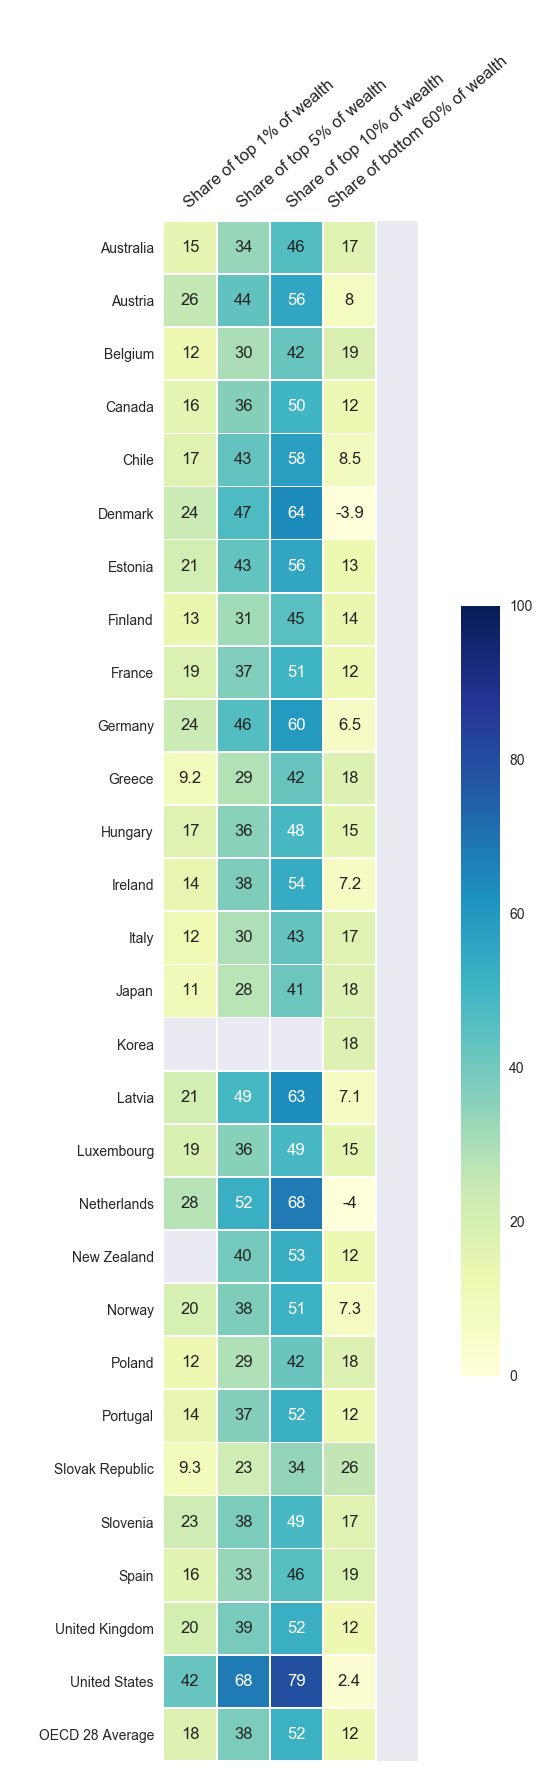
- The richest 1% of households owe, on average, 52% of total wealth
- In the US, the richest 1% of households owe, approximately,79% of total wealth
Dowloading the data
The published dataset is available at:
http://stats.oecd.org/
The dataset is titled Wealth Distribution and can be found under Social Protection and Well Being.
In addition, we will need data on PPP and CPI, available at:
http://stats.oecd.org/Index.aspx?DataSetCode=SNA_TABLE4
http://stats.oecd.org/Index.aspx?DataSetCode=MEI_PRICES#
Note that for the CPI we will use the Consumer prices - all items and for PPP the Purchasing Power Parities for private consumption.